GIPS® Tips

Experience “White Glove” GIPS Standards Verification With TSG
Are you tired of being treated like just another number by your GIPS verifier? At TSG, we prioritize your satisfaction and success above all else.
Partnering with us means gaining access to a team of seasoned GIPS specialists dedicated to delivering unparalleled service and exceptional value. Whether you’re seeking a new verifier, preparing for your initial verification, or just starting to explore GIPS compliance, TSG is the best choice.
Why Choose TSG?
Unmatched Expertise: Our experienced team brings unmatched proficiency in the GIPS standards, ensuring thorough and efficient (not “never-ending”) verifications.
Personalized Support: We understand that the journey toward GIPS compliance is complex. That’s why we offer ongoing support and guidance as needed, as well as access to a suite of exclusive proprietary tools, designed to make compliance and verification as easy as possible for you and your firm.
Actionable Insights: When you choose TSG, you will work with ONLY highly experienced senior-level GIPS and performance specialists. Their expertise translates into actionable advice, helping you navigate the complexities of the Standards in the most ideal way for your firm.
Hassle-Free Experience: At TSG, we guarantee your satisfaction and we do not lock our clients into long-term contracts.
Ready to Experience the TSG Difference?
Take the first step toward a better GIPS standards verification. Schedule a call or request a no-obligation proposal today at GIPSStandardsVerifications.com.

The Journal of Performance Measurement®
This month’s article brief spotlights “Contribution to Internal Rate of Return – Scenarios and Solutions” by Satheesh Jagannathan of BNY, which was published in the Winter 2024/2025 issue of The Journal of Performance Measurement. You can access this article by subscribing (for free) to The Journal (link here).
The Internal Rate of Return (IRR) is a widely used metric in performance presentations especially when the asset manager has complete control over the timing of cash flows. In multi-asset portfolios, it is desirable to see each asset’s contribution to the portfolio’s total IRR. Dr. Stefan Illmer and Wolfgang Marty provided a straightforward approach to compute the IRR contributions. This paper delves deeper into the scenarios and provides an enhanced math that works for all the listed scenarios.
To confirm your email address, click the graphic below. If you’re a subscriber but haven’t received a link to the current issue, please reach out to Doug Spaulding at DougSpaulding@TSGperformance.com.

ATTN: TSG Verification Clients
As a reminder, all TSG verification clients receive full, unlimited access to our Insiders.TSGperformance.com site filled with tools, templates, checklists, and educational materials designed to make compliance and verification as easy as possible for you and your firm.
Contact CSpaulding@TSGperformance.com if you have any questions or are having trouble accessing the site.
Institute / Training
Access TSG’s Online Training
Content With One Pass
In The News
“At Rimes, we choose to partner with TSG because they are a trusted leader in the performance measurement industry. Their deep expertise, credibility, and strong industry relationships help position us in front of the right audience, the decision-makers who matter most to our business.
TSG’s reputation for delivering high-quality insights, industry-leading events, and thought leadership makes them an invaluable partner. Whether through their respected conferences, engaging Forum membership groups, educational resources, or GIPS consulting expertise, they consistently provide access to a network of engaged professionals who are actively shaping the future of investment performance measurement.
By working with TSG, we not only enhance our brand visibility but also strengthen our ability to connect with clients who benefit from our solutions. Their integrity, professionalism, and commitment to the industry make them an essential partner in our growth strategy.”
– Todd Swearingen, Rimes

Article Submissions
The Journal of Performance Measurement® Is Currently Accepting Article Submissions
The Journal of Performance Measurement is currently accepting article submissions on topics including performance measurement, risk, ESG, AI, and attribution. We are particularly interested in articles that cover practical performance issues and solutions that performance professionals face every day. All articles are subject to a double-blind review process before being approved for publication. White papers will also be considered. For more information and to receive our manuscript guidelines, please contact Douglas Spaulding at DougSpaulding@TSGperformance.com.
Submission deadlines
Spring Issue: May 14, 2025
Summer Issue: July 14, 2025
Compliance Corner
The SEC recently published some FAQs regarding their Marketing Rule (see https://tinyurl.com/bdexbbxn), that all SEC registered firms should review. One, in particular, caught our attention, as it’s a subject that has been frequently discussed; what measures constitute performance?
For some time, we have been rather candid that certain statistics, such as attribution and risk, are not, performance. At an annual GIPS conference, one speaker [from the SEC] suggested that yield would be performance, but we totally disagree. This suggestion engendered much discussion and debate. And so, to have this statement from the SEC seems to clarify the topic quite a bit. This item is worth reviewing. Here is the text as it appears in the FAQ document:
Q. The marketing rule does not define “performance” and, as a result, investment advisers may need to determine whether certain portfolio or investment characteristics (“characteristics”) are performance under the marketing rule. If such characteristics are performance, would the staff recommend enforcement action if an adviser displays characteristics calculated without reflecting the deduction of all fees and expenses that a client or investor has paid or would have paid in connection with the investment adviser’s investment advisory services to the relevant portfolio(s) (“gross characteristics”), without also showing the corresponding characteristics calculated after the deduction of all fees and expenses (“net characteristics”)?
A. The staff recognizes that advisers may be unsure whether certain characteristics (e.g., yield, coupon rate, contribution to return, volatility, sector or geographic returns, attribution analyses, the Sharpe ratio, the Sortino ratio, and other similar metrics)[8]are “performance” under the rule. In addition, even if such characteristics were to qualify as performance, calculating these characteristics net of fees and expenses may be impossible or lead to misleading or confusing results. However, in the staff’s view, when an adviser prominently displays the gross and net performance of the total portfolio calculated pursuant to the requirements of the marketing rule and presented in a manner that is not otherwise materially misleading, and provides appropriate accompanying information about the characteristic and how it is calculated, there is little risk that prospective clients and prospective investors will be misled about the impact of fees and expenses on their returns when viewing such a characteristic.
Accordingly, the staff would not recommend enforcement action to the Commission under rule 206(4)-1(d)(1) if an adviser chooses to present in an advertisement one or more gross characteristics of a portfolio or investment, even if it does not include the corresponding net characteristic(s), if:
- the gross characteristic is clearly identified as being calculated without the deduction of fees and expenses;[9]
- the characteristic is accompanied by a presentation of the total portfolio’s gross and net performance consistent with the requirements of the rule;[10]
- the total portfolio’s gross and net performance is presented with at least equal prominence to, and in a manner designed to facilitate comparison with, the gross characteristic;[11] and
- the gross and net performance of the total portfolio is calculated over a period that includes the entire period over which the characteristic is calculated.
Because time periods over which characteristics are calculated may not easily align with the time periods required by Rule 206(4)-1(d)(2), the staff would not recommend enforcement action to the Commission under Rule 206(4)-1(d)(2) if the characteristic presented as described above is calculated over a single, clearly disclosed period.[12]
The staff notes that any advertisement that presents characteristics in accordance with this FAQ remains subject to the general prohibitions of Rule 206(4)-1(a) (as well as section 206(1) and 206(2) of the Advisers Act).
Hope you find this of value.
[8] For the avoidance of doubt, the staff positions stated herein do not apply to total return, time-weighted return, return on investment (RoI), internal rate of return (IRR), multiple on invested capital (MOIC), or Total Value to Paid in Capital (TVPI), regardless of how such metrics are labelled in the advertisement. Whether a presentation of a characteristic in an advertisement is subject to Rule 206(4)-1(d) depends on whether such characteristic is performance. The staff in this FAQ is not taking a position on whether any particular characteristic or attribute should be considered “performance” for purposes of Rule 206(4)-1. To the extent a characteristic is not performance, the presentation of such characteristic would not be within the scope of Rule 206(4)-1(d).
[9] The staff would view an advertisement as clearly identifying that the characteristic is calculated without the deduction of fees and expenses if, for example, it discloses that the characteristic shown does not reflect the deduction of all fees and expenses that a client or investor has paid or would have paid and refers the recipient to the presentation of the total portfolio’s gross and net performance to understand the overall effect of fees.
[10] The view of the staff expressed in this FAQ also applies to characteristics calculated based on the performance of (i) a composite aggregation of related portfolios, (ii) a representative account; (iii) a subset of a portfolio (i.e., extracted performance), and (iv) a subset extracted from a composite aggregation of related portfolios, provided the characteristics are presented in a manner consistent with the FAQ. In the case of a characteristic calculated using a representative account, the staff believes that the adviser could satisfy the positions stated herein if the gross characteristic was accompanied by the gross and net performance of a composite aggregation of all of the representative account’s related portfolios (rather than the gross and net performance of the total representative account) in a manner consistent with the positions stated herein.
Such accompanying presentation of gross and net performance of the total portfolio would be subject to the requirements relating to performance in Rule 206(4)-1(d).
[11] In the staff’s view, gross and net performance of the total portfolio does not need to be presented on the same page of the advertisement as the characteristic, provided that the presentation facilitates comparison between the gross and net performance of the total portfolio and the characteristic. For example, in the staff’s view, presenting the gross and net performance of the total portfolio prior to the characteristic in the advertisement could also facilitate such comparisons and help ensure they are presented with at least equal prominence.
[12] The staff notes, however, that in each case other than a private fund, Rule 206(4)-1(d)(2) requires that advertisements that include accompanying gross and net performance of the total portfolio present such performance over one-, five-, and ten-year periods, each presented with equal prominence and ending on a date that is no less recent than the most recent calendar year-end; except that if the relevant portfolio did not exist for a particular prescribed period, then the life of the portfolio must be substituted for that period.
[13] Rule 206(4)-1(d)(1) prohibits an investment adviser from, directly or indirectly, disseminating any advertisement that includes “any presentation of gross performance, unless the advertisement also presents net performance: (i) with at least equal prominence to, and in a format designed to facilitate comparison with, the gross performance; and (ii) calculated over the same time period, and using the same type of return and methodology, as the gross performance.”
Issue Contents:
The Voice
Author: David Spaulding, DPS, CIPM
In response to a reader’s comments.
We don’t often get comments from readers, but greatly appreciate them when we do. Mike Stevens, CIPM, who is a Vice President at PGIM Fixed Income, offered the following in response to a piece I wrote:
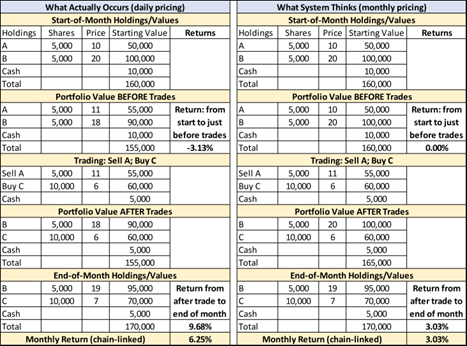
I just read the February Newsletter and would guess you’ll get a few comments on the “Who Knew?” article. When I read the first part of the article that noted suspicion that stale prices might be problematic for daily returns, I was sure the focus would be on the impact of stale prices when there are external flows. That will certainly cause problems, although in my experience the impact is generally immaterial. When I continued to the example I was surprised to see that was not the focus, and that the example was flawed.
In the second part of the example the securities are only valued monthly or when traded. But it’s still a daily calculation and there are as many sub-period returns as days in the month, not just two sub-periods as stated. A daily return calculation would include days of zero return prior to the trades and for days after the trades. There will also be a return of 3.03% for the last day of the month when the securities are re-priced. The key missing piece is the return for the day of the trades of 3.13% (the change in value from 160,000 to 165,000). The correct return for the month is 6.25%. I’ve never seen a system behave as shown in the example.
I’ll include the tables as they appeared:
I’ll go through Mike’s comments point-by-point.
- “it’s still a daily calculation and there are as many sub-period returns as days in the month, not just two sub-periods as stated.”
Quite true. I chose not to include the daily valuations, to save space and because such details are unnecessary, until the portfolio changed in structure, as a result of cash flows or trades.
Consider the following scenario:
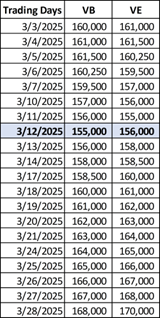
- The start-of-month value is 160,000; and let’s assume we’re talking March So, this is the value as of close-of-business February 28, which is a Friday. This is also the starting value on Monday, March 3.
- Let’s say for argument sake the trade occurs on Wednesday, March 12. So, let’s consider the daily values for this portfolio:
In the left-hand panel of the first table, I mention that the return “just before” the trades is -3.13 percent. I didn’t bother to provide the details as shown in the second panel, but only used the value just before the trade and the start-of-month value:
![]()
But, let’s do this using the daily values, instead.
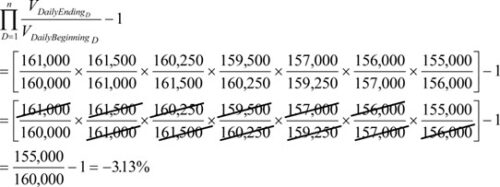
Since the ending value for March 3 is the starting value for March 4 (161,000), we can cancel them out. We learn this from basic arithmetic, correct? And, the ending value on March 4 is the starting value on March 5 (161,500), so, again, we cancel them out. We continue this until the end of the month. After we’re done cancelling common terms in the numerator and denominator, we end up with the same value as shown originally: i.e., the value just before the trade and the value at the start of the month.
The return for the period following the trade is the value of the portfolio after the trade (155,000) and the end of the month (170,000), or
![]()
Based on the way the daily values cancel themselves out for the first part of the month, hopefully the reader will understand that the same thing occurs for the second part of the month.
We geometrically link the returns, to get the return for the month:
![]()
Because we had no external cash flows, we could calculate this return by simply using the end-of-month and start-of-month values:
![]()
And so, yes, I could have put all the daily values into the table, but it wouldn’t have altered the results. Sorry I failed to explain this in the original piece.
- There will also be a return of 3.03% for the last day of the month when the securities are re-priced.
From a daily perspective, using the [now identified] daily values would be from 168,000 to 170,000. However, we really do not care what occurs on that day, because we’ve shown the daily returns net themselves out, by cancelling out common terms between the numerator and denominator.
- The key missing piece is the return for the day of the trades of 13% (the change in value from 160,000 to 165,000). The correct return for the month is 6.25%.
I agree. The correct return is 6.25%. That’s my point. And, as for Mike’s final point:
- I’ve never seen a system behave as shown in the example.
Again, this is my point.
If a vendor offers daily returns but does not require daily pricing, a situation like this can occur.
This vendor, who this piece was based on, retains the same price until the trade day, when the portfolio is revalued. And so, we have:
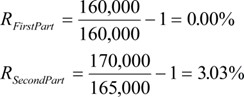
And these returns link to 3.03 percent.
But, there’s more …
Thanks to Mike Stevens for reaching out. By taking another look, I found that I was missing an all important mid-point return for our monthly valuation panel:
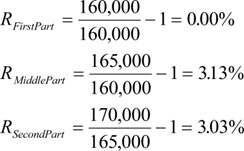
My goof, of course. If we link these three returns, we get the 6.25% return, which matches the daily. This suggests that, in reality, there isn’t a problem if we only value monthly but employ a daily return method. But, not so fast …
What if we have an external cash flow during the period?
I’ve adjusted the earlier example, to introduce a mid-period inflow of $15,000. Note this is less than 10% of the market value, so we are not obligated to revalue with our monthly pricing method.
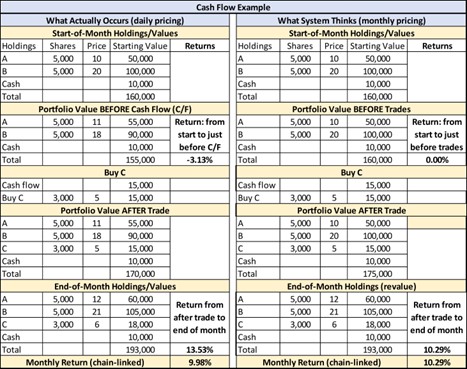
In both cases, we calculate returns from the start-of-the-month to the point just before the flow, and then from the point where the flow occurs to the end of the month. Because when we value only monthly we miss the drop in performance, our return is overstated, 10.29% vs. 9.98 percent.
Again, I thank Mike for his comments, as it caused me to have another look.
Quote of the Month
“You better bring your A-game, as I’m bringing mine.”
Attributed to Gene Hackman
Industry Dates and Conferences
Celebrating 35 Years of Excellence: What to Expect from TSG in 2025
As TSG marks its 35th anniversary, we’re thrilled to announce a dynamic lineup of events, learning opportunities, and networking activities designed to elevate your performance measurement expertise and strengthen our vibrant community. Here’s what’s in store for the year ahead:
April: Forums and Roundtables
Engage with Industry Leaders
- April 23rd: Asset Owner Roundtable (AORT) – Toronto, Canada – A platform for advanced discussions on performance and risk.
- April 24th-25th: North American Forum – Toronto, Canada – Join our membership group for thought leadership, practical insights, and collaborative dialogue.
The Performance Measurement Forum and AORT events foster interactive networking and knowledge sharing, connecting professionals with global leaders to tackle pressing challenges and innovative solutions.
May: PMAR Connections
Join the Premier Conference in Investment Performance Measurement
- May 21st-22nd: PMAR North America at The Heldrich in New Brunswick – Experience cutting-edge sessions and thought-provoking discussions led by top industry speakers.
For over 26 years, PMAR has been the flagship conference where investment performance professionals gather to shape the industry’s future.
June: EMEA Forum in Belfast
- June 19th-20th: Performance Measurement Forum (EMEA) – Belfast, Northern Ireland – Convene with global leaders for dynamic discussions.
Explore performance and risk topics, implementation strategies, and innovative solutions tailored to the European market.
July: Toronto Networking Event
- July 22nd: Performance Measurement Networking in Toronto, Canada – Partnering with Rimes Technologies and First Rate, this event provides a space to connect and share insights.
Stay tuned for additional details on this interactive gathering in one of Canada’s key financial hubs.
September: PMAR Europe in London
- September 17th: PMAR Europe – London’s premier event for innovation and networking.
This is the European counterpart to our North American event, focusing on cutting-edge topics and innovations.
October: Performance Training in San Francisco
Develop key skills with our in-depth, in-person training programs:
- October 7th-8th: Fundamentals of Performance Measurement Training – Ideal for newcomers or those seeking a refresher.
- October 8th-9th: Performance Measurement Attribution Training – Dive deep into attribution methodologies to enhance your expertise.
November: Fall EMEA Forum in Copenhagen
- November 6th-7th: Performance Measurement Forum (EMEA) – Copenhagen, Denmark – Expand your perspective with insights from global leaders at our fall meeting in Denmark.
December: Year-End Wrap-Up in Louisville
Conclude 2025 with these essential events:
- December 3rd: Fall Asset Owner Roundtable (AORT) – Louisville, KY – Advanced discussions to round out the year.
- December 4th-5th: Fall North American Forum – Louisville, KY – Close the year with innovation and collaboration.
Celebrating 35 Years of Excellence
- We take immense pride in our legacy of success, innovation, and leadership. As we look ahead, TSG remains committed to advancing the field of investment performance measurement and empowering professionals worldwide.
Mark Your Calendars! Let’s make 2025 a year to remember.
For information on the 2025 events and membership opportunities, please contact Patrick Fowler at 732-873-5700.
That’s a Good Question
Question: I’m curious if you have any resources or best practice guidance for the treatment of Financial Planning fees in account level performance.
For example, if an advisor charges an advisory fee of 1% of discretionary AUM and an annual financial planning fee of $5,000 – When reporting the performance for that account should the net of fee performance be net of both the 1% AUM based fee and the $5,000?
Response from John D. Simpson, CIPM:
Using the GIPS standards as the example of best practice:
- gross returns would reflect the deduction of transaction costs; if anything else is deducted, you would disclose what that is
- net returns would reflect the deduction of transaction costs and management fees (including performance fees); if anything else is deducted, you would disclose what that is
One might argue that net returns should reflect all costs the investor will incur. If the prospect comes to you directly, then you would not need to be net of fees of advisors that the prospect avoids by coming to you directly. If they come to you via another advisor, an argument could be made to present returns net of that advisor’s services, especially if that advisor is affiliated with you.
You could also show returns before and after the financial planning fees.
This is an area where you should get input from your legal counsel to see what your firm is comfortable showing. The GIPS standards offer flexibility, but you also need to be concerned with the SEC marketing rule. That puts this in the realm of “should” rather than “must.” I would say if the financial planning fees cannot be avoided and/or if they are offered by affiliated advisors, you should consider being net of those fees and disclosing that they have been deducted.
Please submit your questions to Patrick Fowler.
Potpourri
AI Compliance Alert: DeepSeek Raises Security Concerns
The recent introduction of DeepSeek, a high-performance AI model developed with a modest $6 million investment, has prompted swift reactions within the compliance industry. Chuck Martin, MBA, Chief Operating Officer at Vigilant, observes that compliance professionals are imposing significant restrictions on DeepSeek usage, mirroring earlier responses to AI tools like ChatGPT. Some firms have gone as far as banning access to DeepSeek on company-issued devices, even for personal use, due to potential cybersecurity risks.
The AI community has also raised alarms over DeepSeek’s inherent censorship mechanisms. Investigations reveal that the model actively censors discussions on sensitive topics, particularly those politically sensitive in China, such as the Tiananmen Square massacre. This censorship is enforced through two primary methods: training the model to provide specific answers and utilizing server firewalls to shut down restricted inquiries. Notably, these biases persist even when the model is downloaded and operated offline.
Given these developments, it’s crucial for compliance professionals to thoroughly assess the potential risks associated with integrating AI tools like DeepSeek into their operations. Balancing technological advancements with robust security measures remains a top priority to safeguard organizational integrity.

TSG Milestones
Upcoming Webinars / Surveys
Webinar: Should Your Firm Pursue GIPS® Compliance and Verification?
Join us for an insightful webinar exploring the benefits of GIPS® compliance and verification for investment firms. We’ll discuss how adopting these standards can enhance your firm’s credibility and trust, ensure standardized performance reporting, and align with industry best practices. Learn how GIPS® can help attract external capital, improve internal processes, and support regulatory alignment. Whether you’re considering compliance or looking to optimize your current practices, this session will provide valuable guidance to help you make an informed decision.
Don’t miss this opportunity to stay informed.
When: Tuesday, April 8, 2025 at 11:00 AM (ET)
Where: Online (and recorded)
Duration: 60 minutes
Register by clicking on the graphic below or by clicking here.

Book Review
An Officer and a Spy, by Robert Harris
Review by David D. Spaulding, DPS, CIPM

I’ll confess a love of spy, suspense, and mystery genre. I’ve read all of Tom Clancy’s and many of Daniel Silva’s and John Le Carré’s books. This was my first by Robert Harris, and it was utterly amazing.
Not simply because of the suspense aspect; this is an historical novel about the Dreyfus Affair.
While I had heard of this event from 19th century France, I hadn’t previously taken the time to delve into it.
The author begins with a Note: “This book aims to use the techniques of a novel to retell the true story of the Dreyfus affair, perhaps the greatest political scandal and miscarriage of justice in history, which in the 1890s came to obsess France and ultimately the entire world. …None of the characters in the pages that follow, not even the most minor, is wholly fictional, and almost all of what occurs, at least in some form, actually happened in real life.”
A shocking scandal and a truly horrible miscarriage of justice. I will not share any details, as I encourage you to take the time to read it. You will be impressed by the writing but saddened by the events it reveals.
As performance professionals navigate an era of increasing complexity and automation, the evolution of performance analytics technology has never been more critical. In the upcoming PMAR conference session, Alex Shafran, CFA, Ian Thompson, Ph.D., and Shankar Venkatraman, CFA, FRM will discuss their latest paper on how performance teams can maximize the value of technology in their operations.
Their article in The Journal of Performance Measurement (Summer 2024) explores key considerations for firms looking to evolve their performance systems, including:
- Choosing the right operating model including in-house, outsourced, or hybrid solutions.
- Leveraging automation and AI to enhance precision, efficiency, and data transparency.
- Building the right skillset to stay ahead of technology advancements.
- Optimizing vendor relationships and project management for seamless system transitions.
Join us at the conference to dive deeper into how firms can future proof their performance measurement processes and drive innovation in analytics technology.
Don’t miss this insightful discussion on the next generation of performance systems.
Interested in learning more? Sign up for PMAR North America to experience the full presentation.
GIPS® is a registered trademark owned by CFA Institute. CFA Institute does not endorse or promote this organization, nor does it warrant the accuracy or quality of the content contained herein.