One thing that is often overlooked is that William F. Sharpe, PhD, in his paper that introduced the now eponymously named “Sharpe ratio,” referred to his measure as “reward to variability.” He contrasted this with Jack Treynor’s earlier published method, which he labeled “reward to volatility.”
The only difference between the measures was what they chose to use for risk. Treynor went with beta, while Sharpe selected standard deviation. And so, Sharpe saw standard deviation as a measure of variability (and by default, beta as a measure of volatility). He has since acknowledged that it is also a measure of volatility. But for now, let’s focus on the measure as a measure of variability.
Standard deviation as a measure of variability
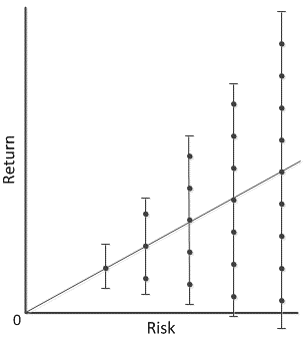
Standard deviation as a measure of variability was addressed quite well by Brian Portnoy in his excellent new book, The Geometry of Wealth. And he conveys it in graphics similar to the following (which I created, based on one of his):

Brian’s point: as we increase risk, we, in turn, increase the potential variability of the resulting returns. He disputes the notion that taking on more risk results in higher returns; no, what it results in is higher dispersion of potential results!
Standard deviation as a risk measure
Standard deviation is frequently criticized as a risk measure, because we typically see it as a measure of volatility, and what does volatility have to do with risk? By changing our focus, and thinking of it as a measure of variability, perhaps we can see how in can provide some additional insights from a risk perspective.
I touch on this at length in this month’s newsletter, which will be published soon. In the mean time, I suggest you pick up a copy of Brian’s book: it’s excellent! Oh, and we expect Brian to join us next May for the Performance Measurement, Attribution & Risk conference in Philadelphia! The dates for PMAR will be announced shortly.
