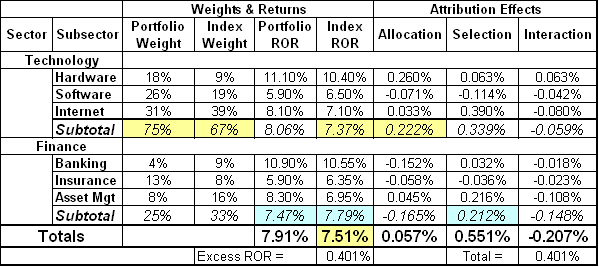
I was sent an attribution problem by a client to research for them. The details appear here:
I’ve highlighted the issues they were concerned with. First, in yellow we find that the technology sector’s allocation effect is positive (0.222%), even though (a) it’s overweighted (75% vs. 67%) and (b) the sector’s index return (7.37%) is below the overall index return (7.51%). How can this be? Note that the Brinson-Fachler model was used, meaning that this situation should result in a negative allocation effect. Why? Because the manager overweighted a sector that underperformed the overall index return (meaning there were other sectors that performed better).
Second, in blue we find that the finance sector’s selection effect is positive (0.212%) although the portfolio underperformed the index (7.47% vs. 7.79%). The model expects the effect to be negative in this case. And why? Because the manager underperformed the index, so the selection effect should be negative to reflect poor selection decisions.
And so, what’s the problem?
Well, if you duplicate these numbers you’ll see that the sector effects were arrived at by adding the effects of the underlying sub-sectors. This isn’t the way it’s done. We need to apply the attribution effect formulas to the sector levels. And when we do that, we get:


