Standard deviation is a commonly used statistic, well known by many long before they enter the world of performance measurement, which serves multiple purposes and thus engenders confusion.
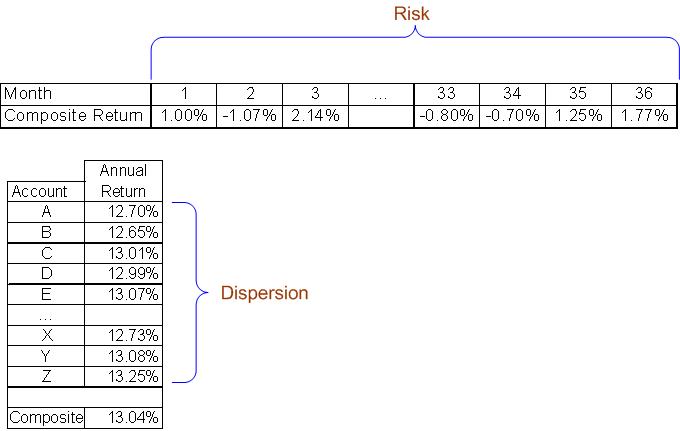
The GIPS 2010 draft proposed a requirement that a 36-month annualized standard deviation be shown by GIPS(R) compliant firms. While it remains unclear whether this will stick (because of the opposition expressed by those who commented), it remains a commonly used r isk measure. It reports the volatility in returns over some time period.
GIPS requires compliant firms to report a measure of dispersion when there are six or more accounts present for the full time period (e.g., if reporting for 2008, you’re required to show a measure of dispersion if there were six or more accounts in the composite for the full year). Standard deviation is often used for this purpose. It shows the dispersion of the returns across all of the accounts for that period. For example, if for 2008 the firm reported a return of 13.04%, we would look at all of the individual account’s annual returns and compare them.
Hopefully, the accompanying graphic helps contrast the uses of standard deviation.

