My colleague, Jennifer Barnette, CIPM, suggested that this blog post from many years ago be published again. I was flattered that she felt it was worthy of reappearing. She was also kind enough to do some edits.
It has been quite some time since I’ve done a blog post. This delay is attributable to a variety of things, including a surgery (I got a new left knee), other family health challenges, and loads of (much welcome) work. It’s not because of an absence of things to say, as there are plenty. And now, with the coronavirus impacting everyone, there are many of us who are now working from home. And in my case, it’s affording me some time to get things done that have been languishing. Again, thanks for Jennifer for making this happen.
Every once in a while, we have the opportunity to be reminded about what performance measurement actually measures. The first time this happened to me was in 1987 (actually, early 1988) following the market adjustment of October 19th. I was working for a New York City-based investment advisor and many of the returns didn’t seem to make sense. Several of our clients had net losses in the value of their portfolios for the year, but were getting reports claiming positive returns. You may find yourself explaining similar returns in the upcoming months.
There are two key points worth addressing:
- First, what’s the explanation when time-weighted rates of return (TWR) produce numbers that appear to make no sense?
- Second, what’s the appropriate return methodology.
QUESTIONABLE RETURNS – HOW CAN THIS BE?
First, some things to recall about TWR
Why does the money management industry require TWR for portfolios? Because they negate the impact of cash flows; whereas, cash flows can impact a money-weighted rate of return (MWR):
We invest one dollar to start. During the first year, our manager realized a 10% return. In year two, they achieved a return of 40%. No cash flows occur. Consequently, the value of the portfolio at the end of the first year is $1.10 and $1.54 at the end of the second year. We calculate an annualized MWR for the portfolio for the two-year period of 24.1%.
A second investor would be just like the first, with the exception that they make a contribution of $1.00 at the beginning of the second year. So, the portfolio starts the second year with $2.10, but still gets the same 40% return. The annualized MWR is 28.6%.
As you’ve seen, the second portfolio benefited from the cash flow, even though the sub-period performance hadn’t changed. Since managers typically don’t control cash flows, they’re not entitled to improved (or lowered) returns from these cash flows. If instead of adding merely a single dollar, the second investor had added $10, his return for the 2- year period would have jumped to 36.7%. And yet, the manager’s actual return for the two years remained 10% and 40%.
Pretty obvious why the industry uses TWR, right? TWR isn’t impacted by cash-flows!
But wait…
You’ll soon see examples of situations when it appears that the cash flows actually impact the rate of return. Hopefully, you’ll come to realize that it’s not the cash flows that impact the return but the way the manager invested these flows.
MONEY-WEIGHTING VERSUS TIME-WEIGHTING
With TWR, we don’t allow the size of the assets to influence the return. TWR shows the value of one dollar invested in a portfolio while MWR shows an average return of all dollars in the portfolio for the period. With our earlier MWR example, we saw that the portfolios with the larger sums in the second period achieved significantly better returns.
Some Examples of Unusual Returns
TABLE 1 – Example A
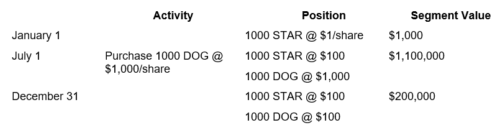
Our first example (A – see Table 1) presents an interesting situation. The portfolio started with a single security (1,000 shares of STAR valued at $1 per share for a total market value of $1,000. On July 1, this security had increased by a phenomenal 9,900%. At that point, the client invested an additional $1 million, with which the manager purchased 1,000 shares of DOG at $1,000. At year-end, the portfolio value had dropped considerably. While STAR’s share price remained unchanged, DOG dropped to $100. The return for the second half of the year was – 81.82%. Geometrically linking the two periods, the return for the year was 1,718%.
Now, doesn’t this cause you to pause and question these numbers, even just a little? Our client gave us a total of $1,001,000 during the year (an initial $1,000 followed by a contribution of $1 million). Her portfolio at year-end was only worth $200,000, meaning she lost $801,000. And we claim a 1,718.18% return? Intuitively, we’d probably expect a huge negative return, not an outstandingly positive one.
Let’s back up for a moment. What are we measuring, the performance of the manager or the net change in assets? Could the manager control the client’s decision to invest a mere $1,000 when he was doing so well, and to hand over $1 million just at the wrong time. (Where was that $1 million at the beginning of the year? Surely not making a 9,900% return!)
Had we chosen to measure the return using a MWR rather than a time-weighted return, we’d get -80%.
When we use a TWR, we’re measuring the manager’s investment acumen, regardless of the amount of money invested. A 9,900% return linked with a -81.82% return will always yield a 1,718.18% return, independent of the amount of money in the two time periods.
Let’s modify Example A (please refer to table B). Here, our client gave us $1 million at the start. We purchase 1 million of STAR at $1 on January 1 for an investment of $1 million. On July 1, STAR has increased in value to $100 and our portfolio is worth $100 million (my, how happy our client is).
TABLE 2 – Example B
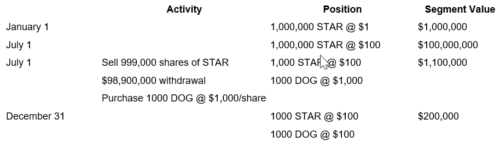
The client wants to withdraw some of her new-found wealth, so we sell 999,000 shares of STAR, leaving 1,000 shares valued at $100 for a market value of $100,000. The 999,000 shares sold raises $99,900,000. Of this, the client withdraws $98,900,000. The $1 million remaining is used to purchase 1,000 shares of DOG at $1,000 per share.
Well, December 31st comes and STAR remained flat but DOG was not our idea of a best friend, and ended the year at a lousy $100. The portfolio is only worth $200,000, so our client lost $900,000 during the latter part of the year.
As in Example A, the return for the year is 1718.18%. But this time, our client has a net gain of over $99 million. (I don’t think she will be that upset about the 81.82% drop in the last six months, do you?)
So, what’s the difference between A and B? Answer: the dollar amount invested.
Did the manager do anything differently between A and B? No. He had the same six-month return at the beginning of the year (9,900.00%) and the same return for the second half (-81.82%).
Will the two clients behave any differently when they receive their annual statements claiming a return of 1,718.18%? Probably.
Client A will say, “Are you crazy? I lost a bundle! How can you report a positive return!!?!” Client B, may ask, “Is that all? Surely, you’re understating your phenomenal success!” And they’ll both be wrong.
The manager’s performance is based on the rates of return. Not on the net dollars raised or lost.
What Are Time-Weighted Returns Measuring?
What Are Money-Weighted Returns Measuring?
So, what’s the problem? Are we missing something or is there a problem with the TWR methodology? What are we attempting to measure with the TWR?
When we calculate a TWR, we want to know how the manager performed, regardless of the amount of money invested. This assumes the manager has little control over the amount of money they manage.
Time-weighted returns don’t worry about the amounts invested from one period to the other. Rather, they look at what was done with the money there, regardless of the amount.
And certain managers, too, don’t report their performance any differently when they have more money or less. We don’t see a mutual fund trying to differentiate one period’s return with another, based on the amounts invested or the net proceeds generated as a result of their investing.
WHICH METHOD IS RIGHT?
Time-weighted returns negate the effects of cash flows. But what if the manager controls the cash flows?
Isn’t that what happens with sub-portfolio returns (e.g., asset class, industry sectors, investment themes)? Doesn’t the manager decide when money should be shifted from one group to another.
A TWR shows the value of one dollar invested in a portfolio or sector for the entire period, while a MWR shows an average return of all the dollars in the portfolio or sector for the period.
I recommend that when the manager makes asset allocation decisions, the sub-portfolio returns be derived using a MWR. Here, the effect of cash flows should be felt by the derived return. However, if the manager retains only partial discretion, both time and dollar weighted returns should be illustrated.
If a manager doesn’t control the cash flows, their clients can’t fault them for having less invested when the market is doing well and more when it’s not. The manager can only be measured on his performance with what he’s been given.
Since a MWR measures the performance of the controller of the cash flows, should we be presenting a MWR for the portfolio, in addition to the TWR, as a way for the client to better understand the effect of their decisions to contribute and withdraw cash? Afterall, the client often looks at their initial investment, plus or minus cash flows, and compare it with their present value. There could be a situation when you have a positive TWR and a negative MWR at the portfolio level. Might as well get ahead of that conversation by disclosing both returns.
CONCLUSION
When you encounter an unusual or questionable TWR, try to disengage yourself from the dollar values and focus on the sub-period returns. Do they make sense? If so, then the linked return is probably correct (assuming the formula is accurate).
But also consider whether TWR is the appropriate measurement. If it is, great! But think about providing a MWR, too, that reflects the performance of the controller of the cash flows!